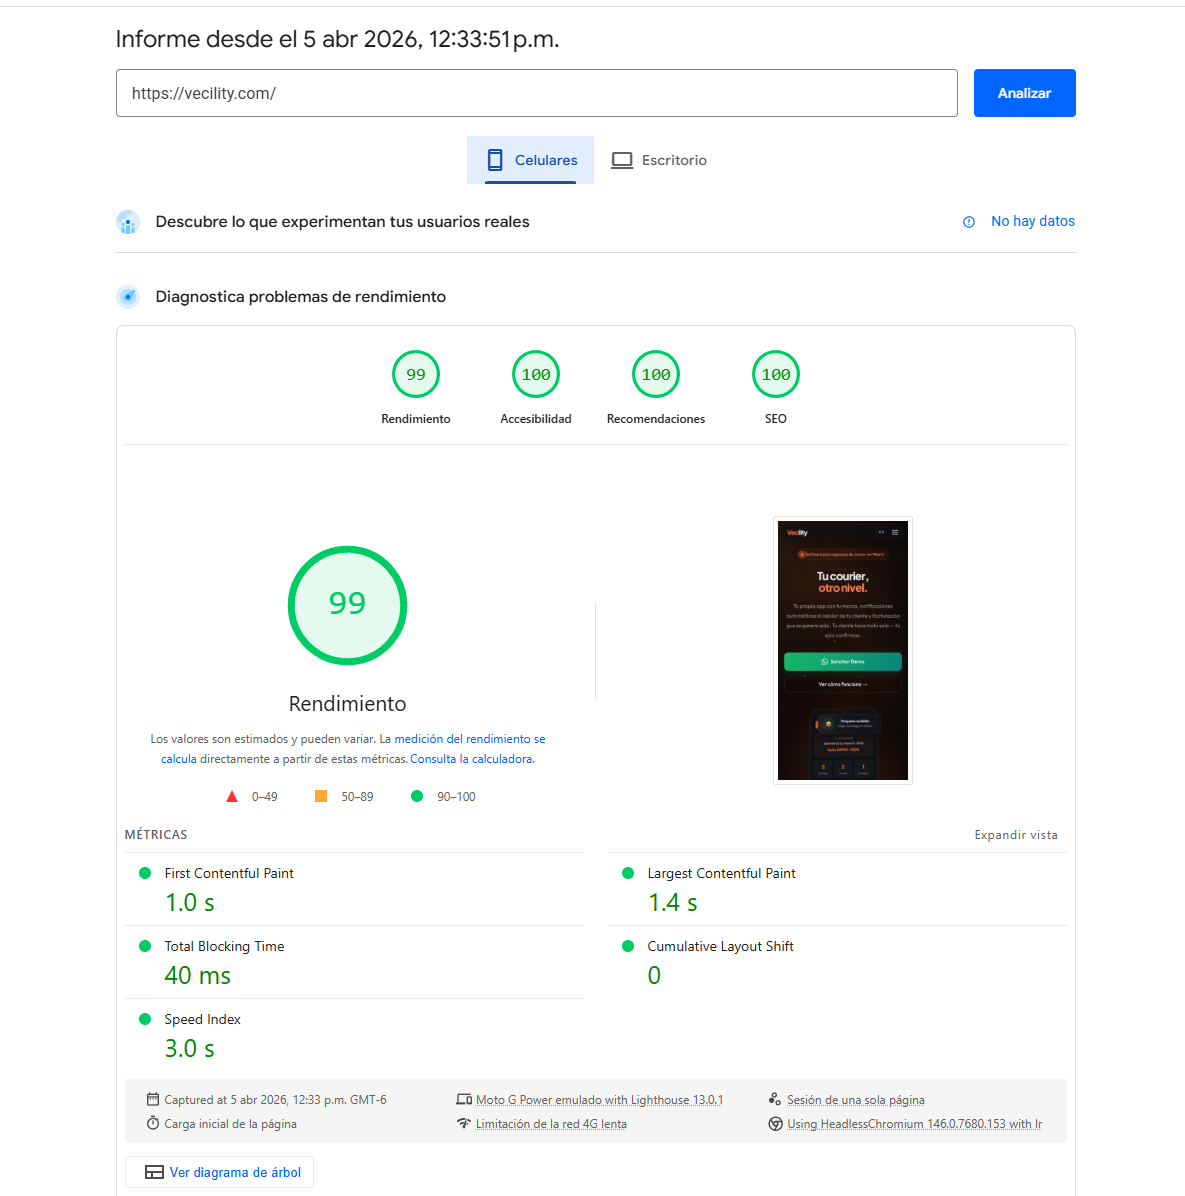
Vecility.com scores 99 on mobile Lighthouse. Not on a fast connection — on a Moto G Power emulated on slow 4G. FCP: 1.0s. LCP: 1.4s. TBT: 40ms. CLS: 0. Accessibility: 100. SEO: 100.
This isn’t a static HTML page. It’s a bilingual SaaS landing with canvas particle animations, interactive navigation, accordion FAQ, and multiple React islands — running on a Hetzner VPS, not Vercel or any edge platform.
Vecility is our own product — a white-label SaaS platform for courier agencies, built by Deploytive. We’re sharing this case study openly because you can verify every number yourself: open Chrome DevTools on vecility.com and run Lighthouse right now.
Here’s every problem we found, what caused it, and how we fixed it.
The starting point: 90 on desktop, 63 on mobile
When we first ran Lighthouse after launching Vecility, desktop scored 98. We almost moved on.
Then we ran the mobile test with slow 4G throttling — the real conditions our target market experiences. The score was 63. FCP: 4.6 seconds. LCP: 6.7 seconds. Our users were staring at a blank screen for almost 5 seconds before seeing a single word.
Desktop lies. A site that feels instant on your MacBook with fiber can be unusable on a mid-range Android phone on a cellular connection. From that point, we committed to testing exclusively on mobile with throttling enabled.
Problem 1: The hero text took 2.7 seconds to appear
What we saw: Lighthouse flagged the LCP element — the hero headline — with a “render delay” of 1,460ms. The server responded in 0ms (Time to First Byte was perfect). The HTML was already in the browser. But no text appeared.
The diagnosis: The browser was waiting for a typography file (Plus Jakarta Sans, weight 900) to download from Google’s font servers before rendering a single letter. This required a DNS lookup to fonts.googleapis.com, a TLS handshake, downloading a CSS file, then a second DNS lookup to fonts.gstatic.com, a second TLS handshake, and finally downloading the actual font file. On desktop with fiber optic, this takes about 100ms. On a Moto G Power with slow 4G, it took 1,460ms.
How we solved it: We downloaded the font files and served them from our own server — eliminating both external connections entirely. We configured the fonts with font-display: swap, which tells the browser: “paint the text immediately with the system font, and when the custom font arrives, swap it in.”
One critical detail we discovered: font-display: swap only works if you define a fallback font stack. If you tell the browser “use swap” but don’t give it an alternative, it has nothing to swap to. We added the operating system’s default fonts as the fallback chain.
We also only preloaded the 2 font variants used above the fold (the headline weight and the body text weight). Fonts used further down the page — like the monospace font for code elements — load naturally when the browser needs them.
The result: The hero headline went from painting at 1,460ms to painting in approximately 50ms. Just by serving fonts from the same server instead of depending on Google.
Problem 2: Google Analytics was blocking the first render
What we saw: The Google Analytics script (gtag.js) was in the <head> with async. On desktop, this doesn’t matter — there’s plenty of bandwidth. On slow 4G, 150KB of JavaScript competes with fonts and CSS for the same limited bandwidth.
The diagnosis: async doesn’t mean “doesn’t block.” It means “download in parallel but execute as soon as it arrives.” On a slow connection, gtag.js was arriving BEFORE the hero fonts, and the browser prioritized executing it. The user doesn’t need analytics to see the page — but the browser doesn’t know that.
How we solved it: We moved Google Analytics to deferred loading: the script is injected 2 seconds after the page has already painted. The tracking works exactly the same — it just starts counting 2 seconds after page load. No user notices the difference. But the browser has 150KB less competing for bandwidth during the critical first render moment.
The result: 150-300ms less on FCP on slow connections. Analytics still reports the same metrics in GA4 with no data loss.
Problem 3: The navigation bar forced the entire React framework to load
What we saw: In the network dependency tree, the navigation bar (Navbar) appeared as the heaviest node: 1,306ms. Behind it came the entire React runtime — jsx-runtime, the framework index, and the hydration code. Total: approximately 182KB of JavaScript that needed to be downloaded, parsed, and executed before the hero below it could paint.
The diagnosis: Astro allows using React components with a directive called client:load that tells the framework: “hydrate this component immediately on page load.” The navbar was using that directive. The problem is that a navbar is static HTML with two simple interactions: sticky behavior on scroll and a hamburger menu on mobile. That doesn’t need React.
But because the navbar used React with client:load, it forced the download of the entire React runtime BEFORE the browser could paint anything below it — including the hero with the headline and subheadline (our LCP element).
How we solved it: We rewrote the navbar as a pure Astro component — static HTML with an inline vanilla JavaScript script. The sticky scroll behavior is 3 lines of JS. The hamburger toggle is 5 more lines. The language toggle is simply an anchor tag that navigates between / and /en/. None of these features need a 182KB framework.
After removing React from the navbar, React only loads when the user scrolls to components that actually need it (the particle canvas, the contact form) — thanks to the client:visible directive that hydrates components only when they enter the viewport.
The result: 1,306ms eliminated from the critical chain. The hero paints immediately without waiting for React to download, parse, and execute.
Lesson learned: We searched the entire project for client:load and eliminated it completely. Rule: if a component doesn’t need React state, complex interactivity, or dynamic re-renders, it shouldn’t be React. HTML plus vanilla JS is sufficient and is free in performance terms.
Problem 4: CSS from an invisible section was blocking everything
What we saw: In the dependency tree, a 42KB CSS file appeared as part of the critical chain. It was the CSS for the FAQ component — a section at the bottom of the page, invisible without scrolling.
The diagnosis: Astro extracts each component’s styles into separate CSS files and includes them as <link> tags in the <head>. This is good for caching but bad when a below-fold component has heavy styles — because the browser will not paint ANYTHING until ALL CSS files in the <head> download.
Our FAQ had styles for the accordion (open/close animations, transitions, borders) totaling 42KB. Those 42KB were blocking the first paint of the hero that sits 3,000 pixels higher.
How we solved it: We configured the FAQ styles to render inline where the component appears in the HTML, not as an external file in the <head>. When the browser reaches the <head>, it doesn’t find those 42KB of blocking styles. The FAQ styles load naturally when the browser scrolls to that section.
The result: 543ms eliminated from the critical chain. The FAQ looks and works exactly the same — but its styles no longer penalize the first render.
Problem 5: The particle animation forced layout recalculations
What we saw: Lighthouse reported a “forced reflow” warning — the browser was being forced to recalculate the page layout at inappropriate moments.
The diagnosis: The particle canvas animation needed to know its container’s dimensions to set the canvas size. During initialization and window resizing, the code read the container dimensions (width and height) immediately after modifying the canvas. This forces the browser to stop everything, recalculate the complete page layout, and return the requested values. On a mid-range phone, this blocks the main thread for 10-50ms each time.
How we solved it: We synchronized the dimension reading with the browser’s render cycle. Instead of reading dimensions immediately (forcing the recalculation), we tell the browser: “next time you’re going to paint, give me the dimensions.” The browser calculates them once as part of its normal cycle, without interruptions.
We also added a 1-second delay on mobile before starting the particle animation. This lets the hero paint first and the user sees content immediately — the particles appear a second later as a visual effect. On desktop there’s no delay.
The result: The forced reflow warning disappeared. TBT (Total Blocking Time) stayed at 40ms — excellent for a page with canvas animations.
The final numbers
| Metric | Before | After |
|---|---|---|
| Performance (mobile) | 63 | 99 |
| FCP | 4.6s | 1.0s |
| LCP | 6.7s | 1.4s |
| TBT | 50ms | 40ms |
| CLS | 0.007 | 0 |
| Speed Index | 5.9s | 1.4s |
| Accessibility | 100 | 100 |
| SEO | 100 | 100 |
These are metrics from a Moto G Power emulated on slow 4G — not a MacBook Pro with fiber optic. These are the real conditions of our target market.
Don’t take our word for it — run the test yourself: PageSpeed Insights for vecility.com.
What we learned
Desktop lies. A site can score 98 on desktop and 63 on mobile. If you don’t test on mobile with slow 4G throttling, you don’t know how real users experience your site.
“Async” doesn’t mean “doesn’t block.” Scripts, fonts, and CSS with async still compete for bandwidth. On slow connections, everything non-essential for the first render should load after it.
Frameworks are expensive. 182KB of React for a hamburger menu is a luxury that users on 4G cannot afford. The right question isn’t “can I use React here?” but “do I need React here?”
Problems chain together. Each blocking resource doesn’t just add its own time — it creates a chain. Font depends on CSS depends on DNS. The solution isn’t to optimize each link but to break the chain.
90 is not enough. 90 on Lighthouse sounds good until you see your user waiting 4.6 seconds to read the first text. Performance is not a score — it’s the real experience of a person waiting for their screen to stop being blank.
About this project
Vecility is a white-label SaaS platform for courier agencies, built by Deploytive. We apply the same performance engineering rigor to every system we build — SaaS platforms, mobile apps, enterprise tools.
If your site or application is slow and you’re not sure why, we can help diagnose the problem and fix it.